Microsoft Social Infographics
Objective
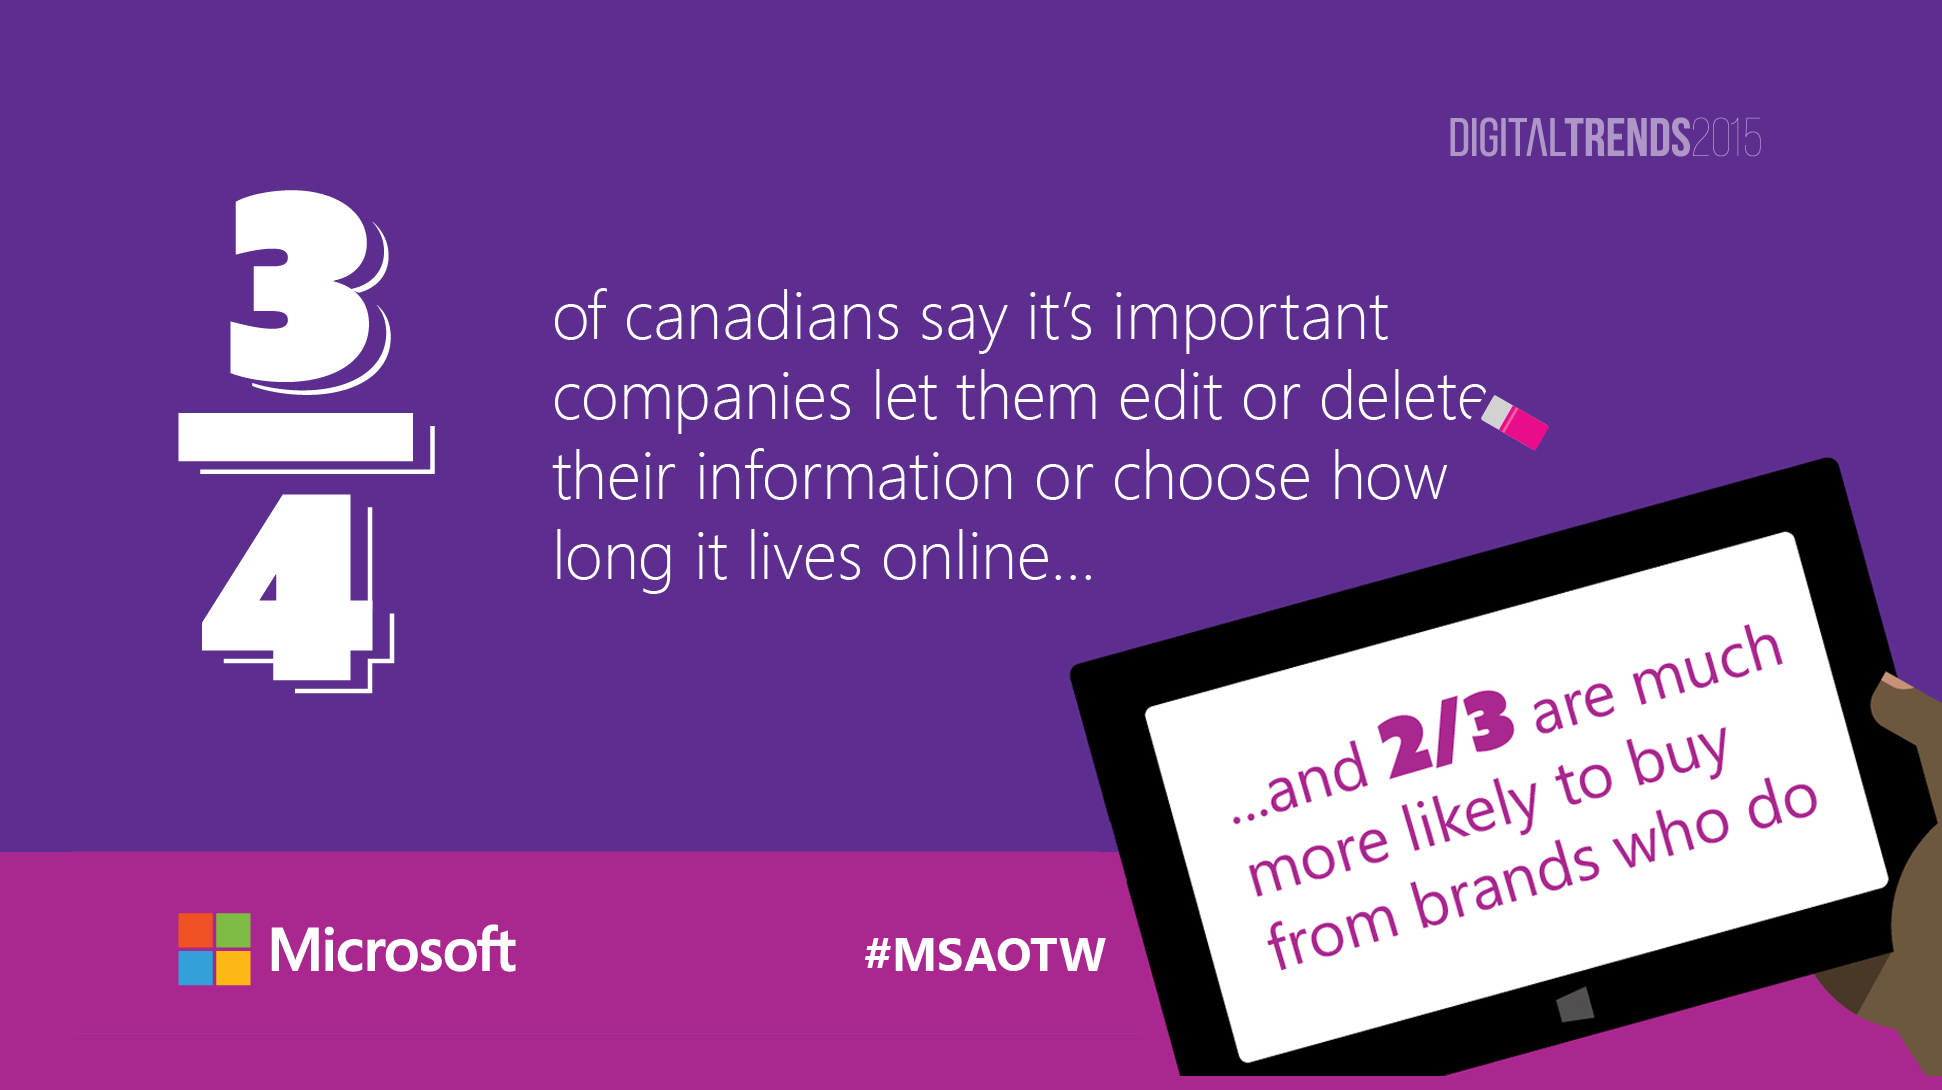
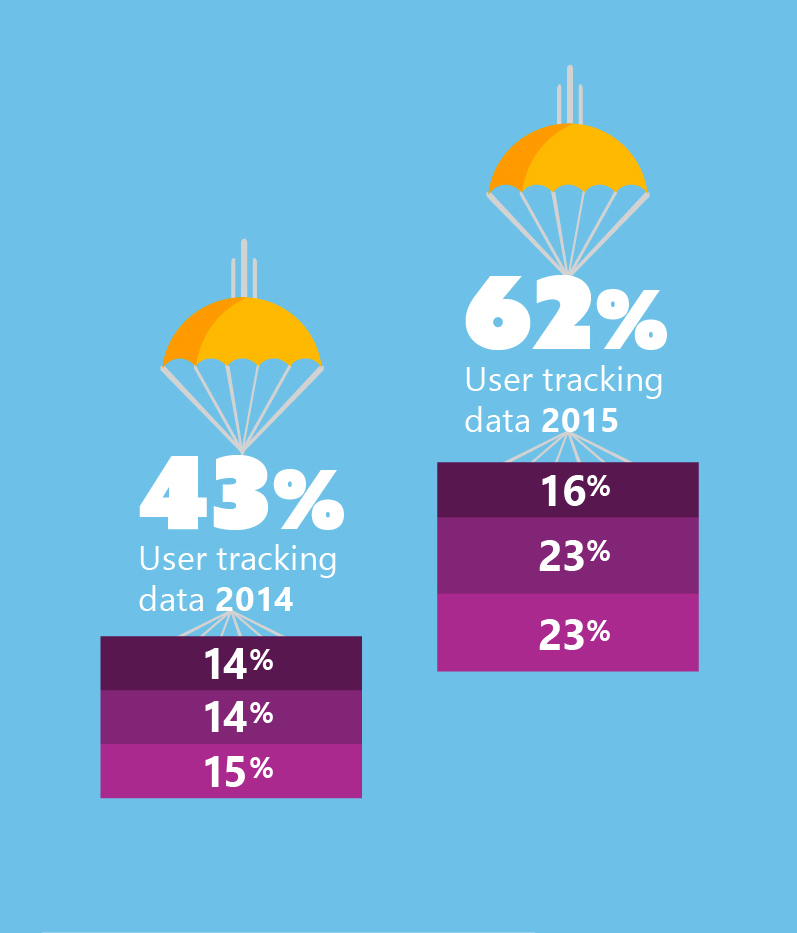
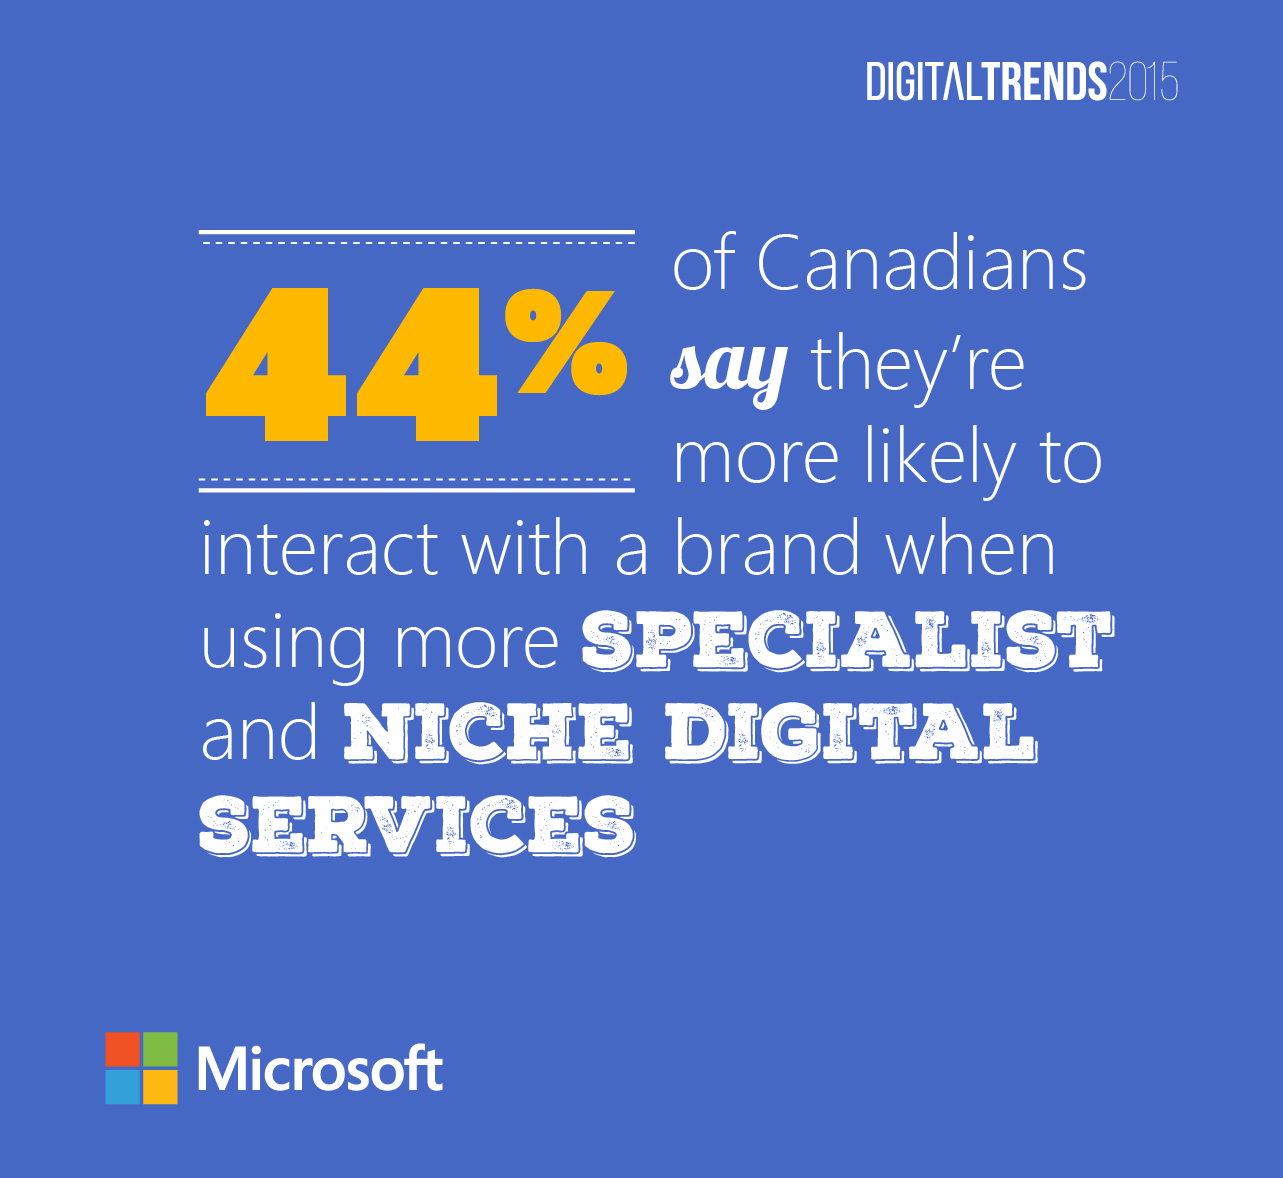
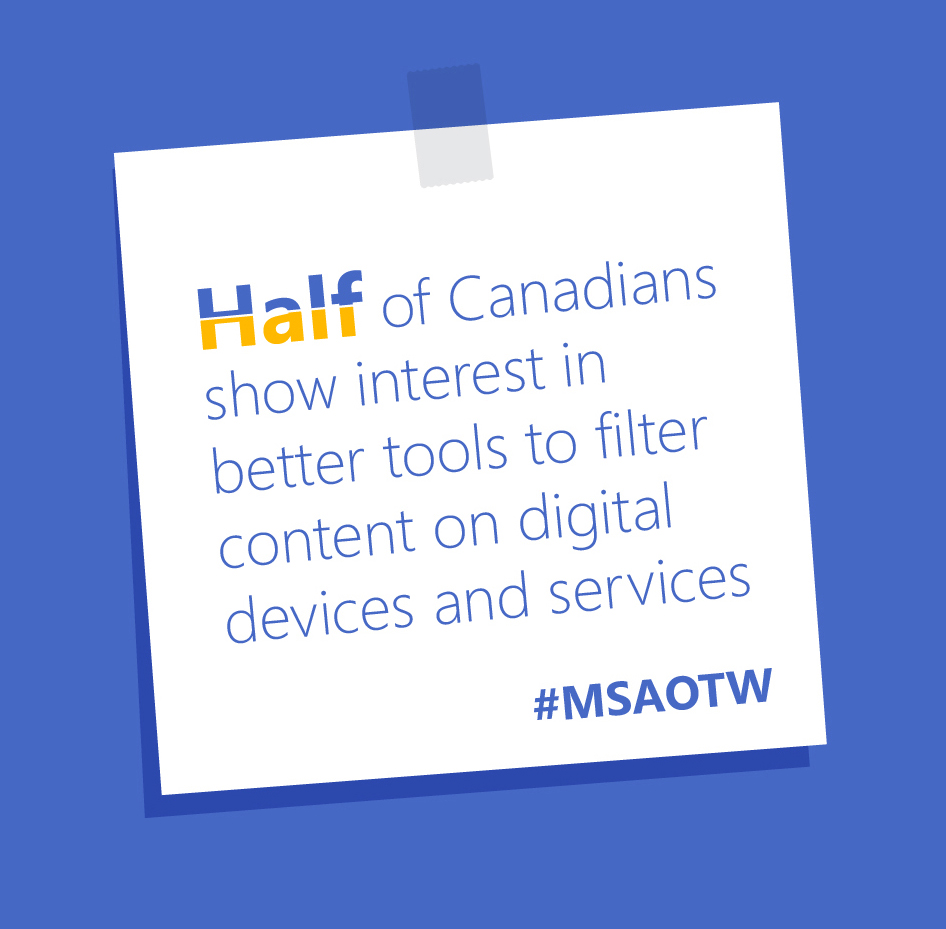
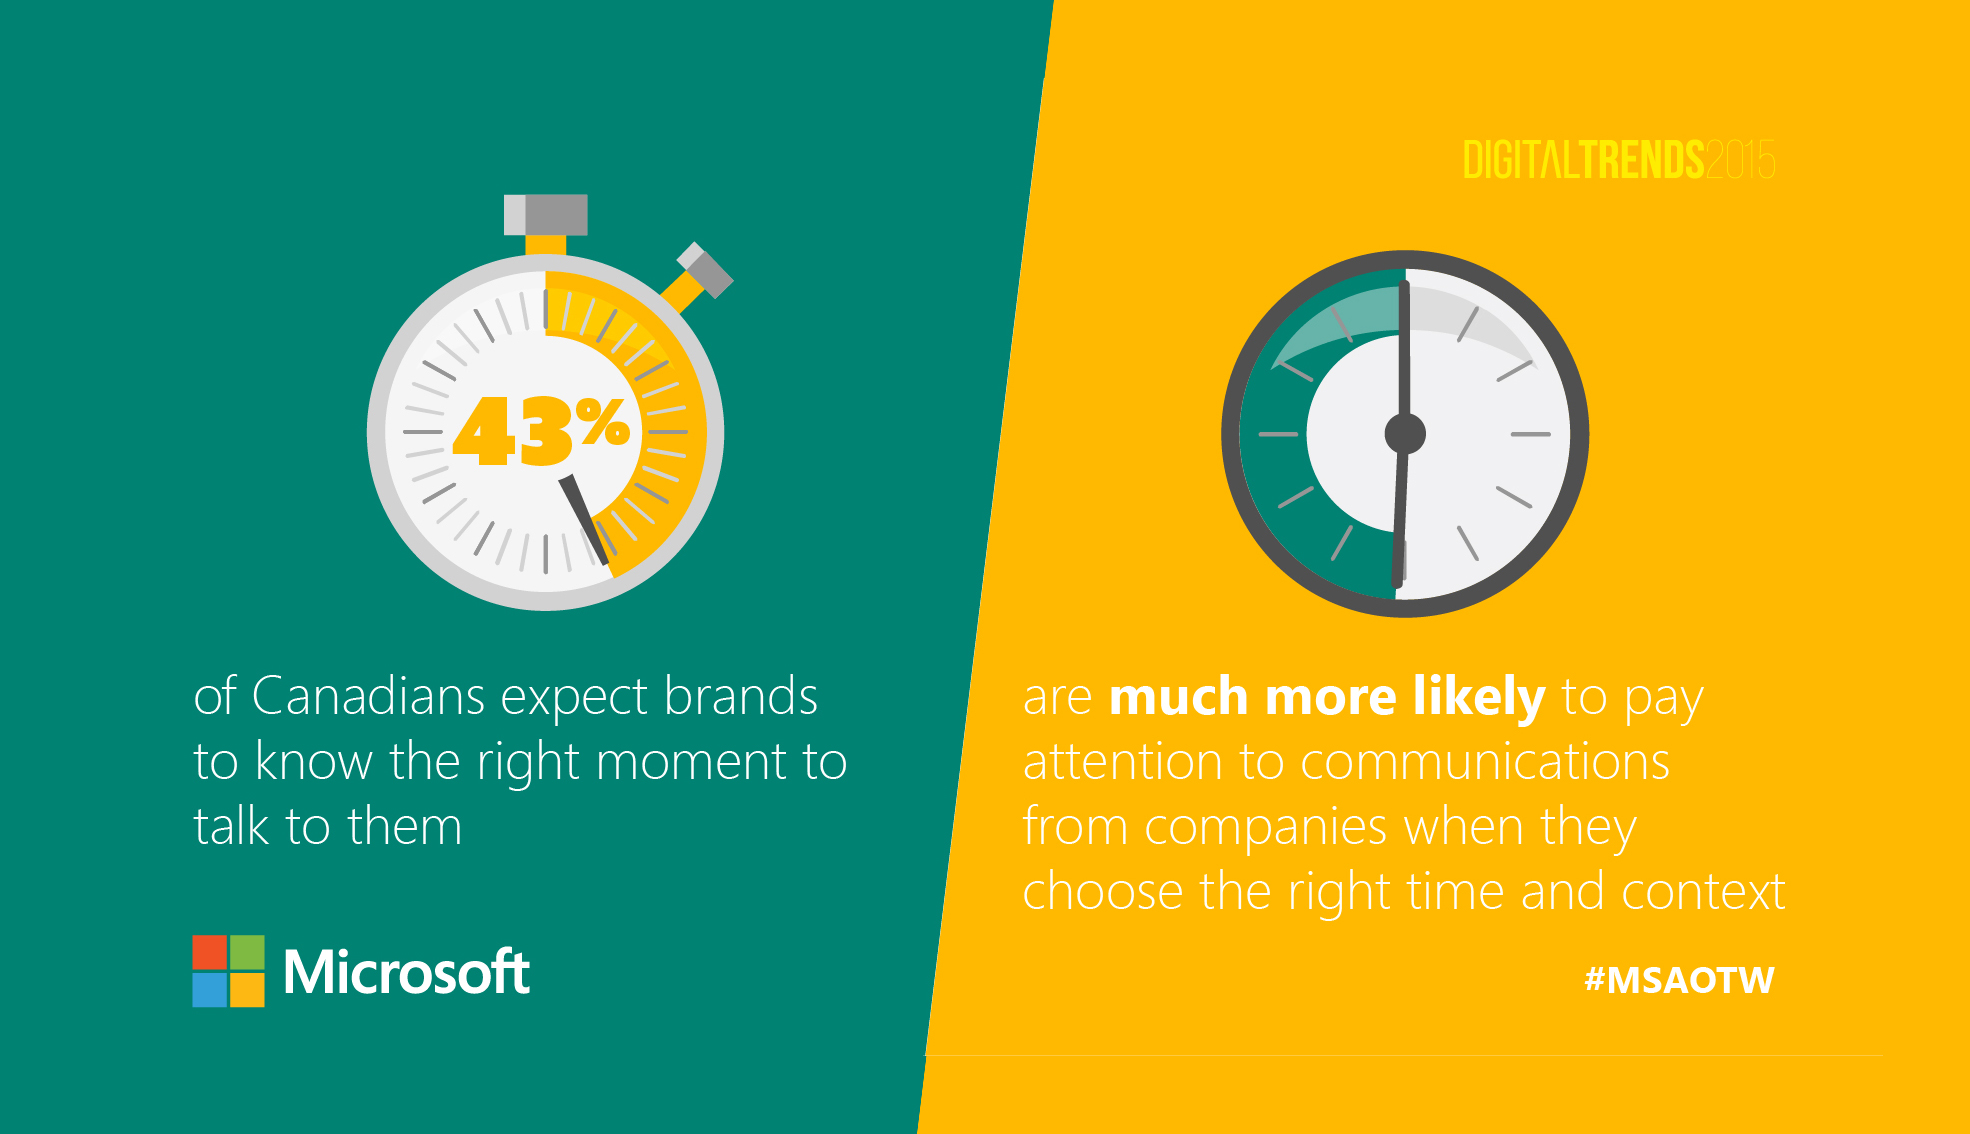
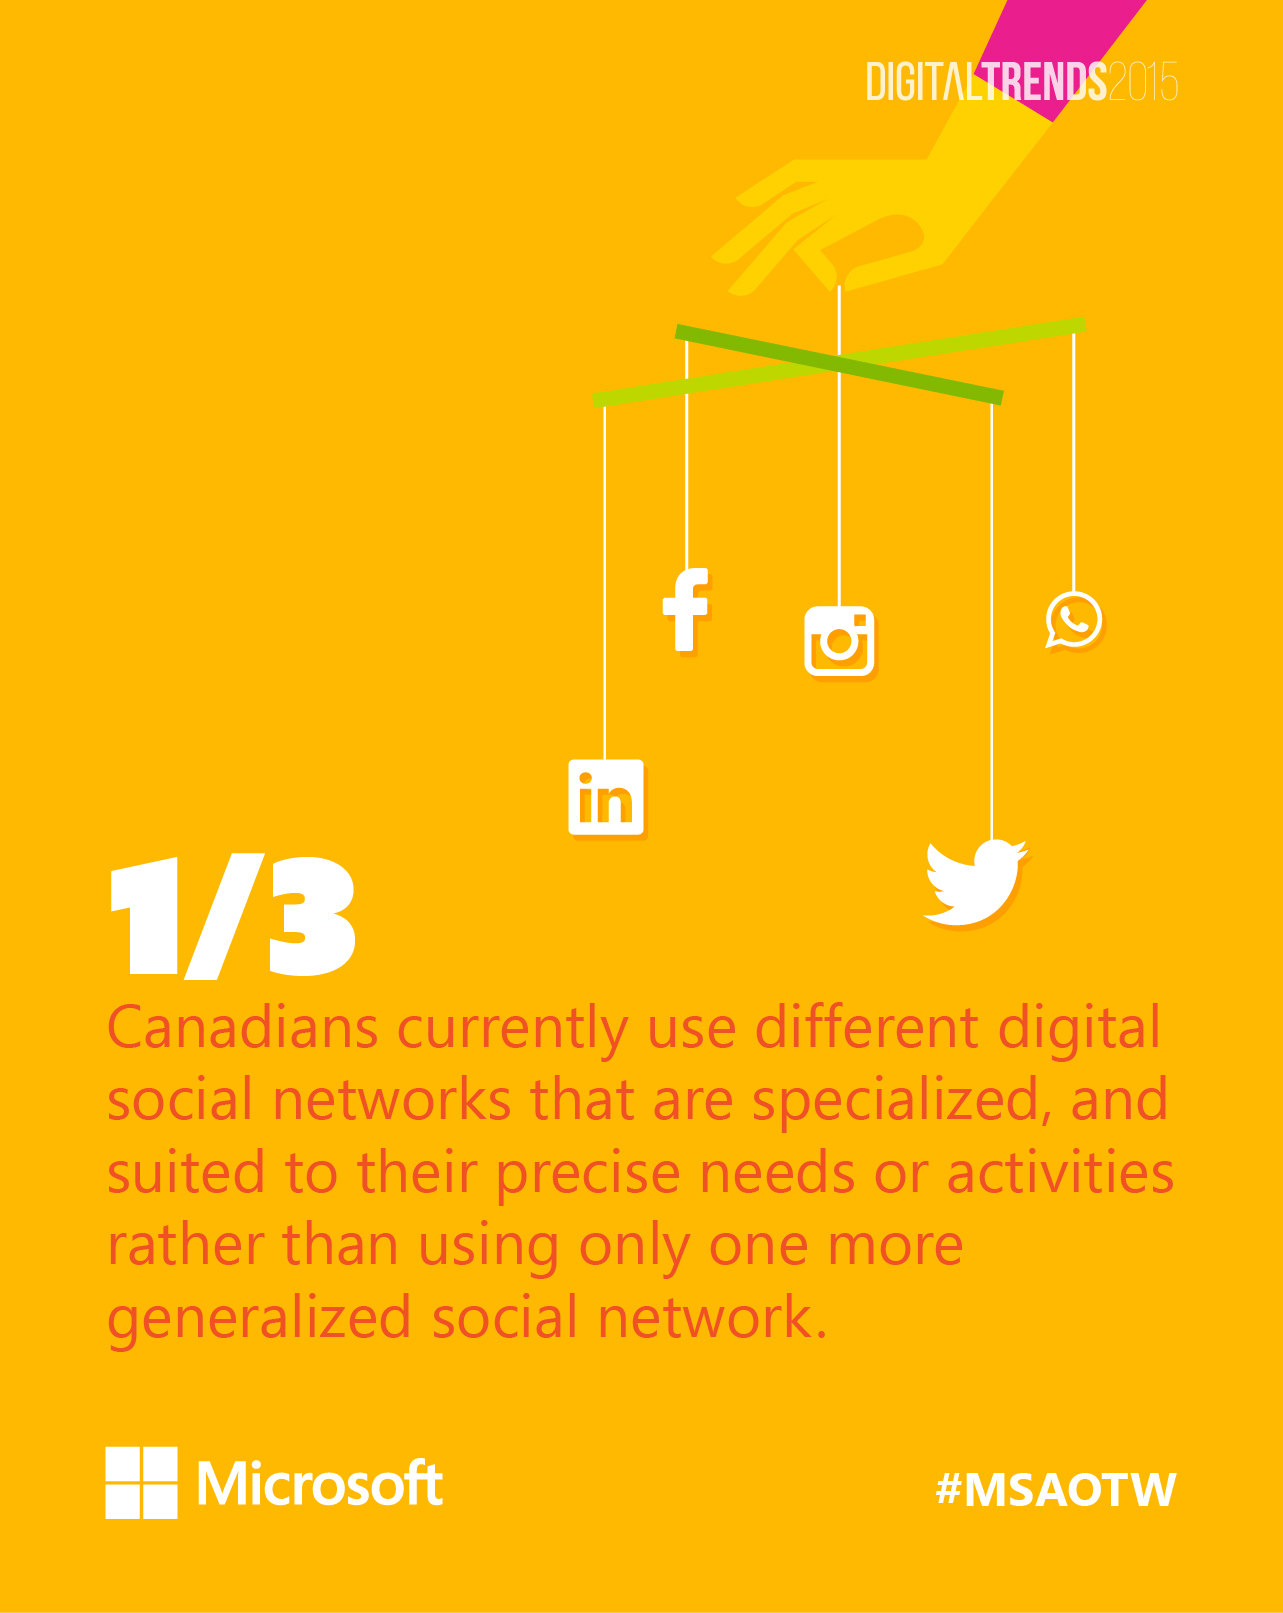
Statistics can sometmes be quite long and boring to read, especially when our attention span have been descreasing significantly throughout the years. How should we simplify these data and present it to our users is a real challenge.
These social infographics are to be showned mainly on Facebook, Twitter, and screen displays in the Canadian office.
Solution
Using the combination of colours, hiearchy of information (i.e. emphasizing on different data), and the types of illustrations help create a playful and dynamic design that are both appealing and easily communicated to the audience.
Deliverable
• Infographics
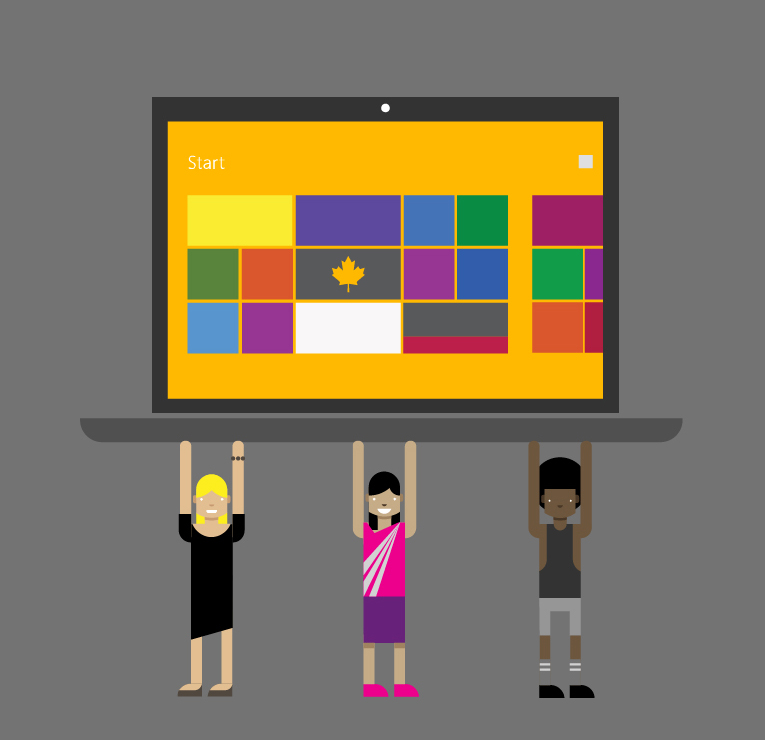
• Illustrations
• Different sizes (i.e. Facebook, Twitter, etc)
